The 19th Hole
Talking Stick Golf Club – Convenient Location, Unique Heritage and Unforgettable Golf
2019 Arizona Summer Troon Card!
Golfers Are Good People – Especially…
Make Golf Fun!
Let’s Go to Idaho
Imperfectable
It’s High School Season Everywhere!
Lessons From The Lesson Tee
LPGA Founder and Arizona Local Marilynn Smith Dies at 89
Arizona Golfer says “Good Day†to the Arizona Golf Community
Arizona Golfer’s Sincere Gratitude to Our Dedicated Team
104th annual Southwestern Amateur tournament scheduled June 12-15 at Desert Mountain Club
Troon announces 2019 Troon Challenge Schedule
22nd annual Shriners Golf Classic presented by Sanderson Ford scheduled for May 19th at Gainey Ranch Golf Club
U.S. Air Force Veteran Edward Britton of Arizona earns PGA Master Professional designation
2019 Cologuard Classic makes big impact on Southern Arizona
Waste Management Phoenix Open extends partnership with MillerCoors through 2025
Summerhays siblings top the leaderboard at the Bryce Molder Invitational
Phillis Meti, Tim Burke win 2019 Ak-Chin Smash in the Sun World Long Drive
CEO of Daphne’s Headcovers joins The First Tee of Phoenix board of director
Nonprofit Gabriel’s Angels names Tami Butcher & Kari Yatkowski as Co-Chairs for Salud! 2019 at the Omni Scottsdale Resort & Spa at Montelucia
The Thunderbird International Junior celebrates 20-Year anniversary
5th Annual Ronald McDonald House Charities Pro-Am Golf Tournament is set for May 16 at Grayhawk’s Talon and Raptor courses
2019 Waste Management Phoenix Open and The Thunderbirds raise record-breaking $13.2 Million for Arizona charities
Pronghorn Resort announces debut of high desert, design-forward Huntington Lodge
Tees for Touchdowns fundraiser – Gridiron Golf Classic
Monster 413 yard drive sets new World Record by Phillis Meti and Exotics EXS Driver
Johnny Miller Golf Academy 2019 dates at Silverado Resort and Spa in Napa Valley
The Spirit International Amateur Golf Championship announces LPGA standout Stacy Lewis as USA Team Captain
Troon acquires OB Sports Golf Management
Perfect ProAms to host its first event of 2019 in Scottsdale, Arizona
Award winning Sandia Golf Club receives site-wide tee enhancements and drainage upgradeÂ
Fairmont Caddie Confidential
Archived Articles

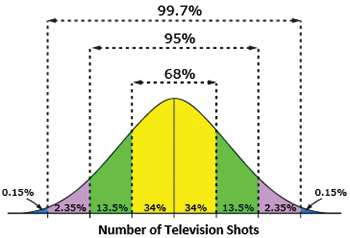 I often hear a lot of “I Should be” statements during a lesson and especially in my Signature Schools. The statements typically revolve around what the player feels their statistics should be in a few key areas of the game. The most common is carry distance, the next is greens in regulation, proximity to the hole and total putts. I want to preface this by outlining how watching golf on television can psychologically impact the perceived reality one operates within when it comes to their statistical expectations on the course. To showcase this point, let’s say you have a full field, 154 player event, the average score for the entire tournament is 72 and you cut to 60 players after 2 rounds. Prior to the cut, you’d have a total of 22,176 shots hit by the players. The final 2 rounds, a total of 8,640 shots would be struck. Let’s create a commercial free utopia for our example event. This event has 8 hours of television coverage for the 1st two days and 4 hours for each of the final 2 days, totaling 24 hours. Next, we’ll say each telecast can show 4 shots per minute (1 every 15 seconds). That ends up being 240 shots per hour, 1,920 shots over each of the 1st two days and 960 shots on each of the final days. To summarize: 30,816 Total Shots, 5,760 Total Televised shots


 Greg
Greg Mark
Mark John
John Kim
Kim Jeff
Jeff Tom
Tom Rob
Rob Alice and Danny